Tutorial 4: Single-cell Human PBMC (ATAC + RNA + Protein Epitopes)#
Welcome to tutorial on using the mTopic package for multimodal topic modeling of human peripheral blood mononuclear cells (PBMC), using the DOGMA-seq dataset. We use a publicly available dataset from GEO, which includes ATAC, RNA, and protein epitope measurements.
Let’s begin by downloading the filtered training data, available at Zenodo.
[1]:
! wget -O HumanPBMC_filtered.h5mu \
  "https://zenodo.org/records/20044694/files/HumanPBMC_filtered.h5mu?download=1"
--2026-05-06 23:09:23--  https://zenodo.org/records/20044694/files/HumanPBMC_filtered.h5mu?download=1
Resolving zenodo.org (zenodo.org)... 188.184.103.118, 188.185.48.75, 188.185.43.153, ...
Connecting to zenodo.org (zenodo.org)|188.184.103.118|:443... connected.
HTTP request sent, awaiting response... 200 OK
Length: 71515449 (68M) [application/octet-stream]
Saving to: ‘HumanPBMC_filtered.h5mu’

HumanPBMC_filtered. 100%[===================>]  68.20M  52.1MB/s    in 1.3s

2026-05-06 23:09:25 (52.1 MB/s) - ‘HumanPBMC_filtered.h5mu’ saved [71515449/71515449]
Non-Spatial Multimodal Topic Modeling#
The filtered dataset contains 7,349 cells and includes three modalities:
atac: chromatin accessibility data (136,915 peaks),rna: gene expression data (10,000 genes),prot: protein epitope data (208 surface proteins).
This rich multimodal structure enables a joint modeling of transcriptional activity, regulatory accessibility, and protein epitope expression at single-cell resolution.
[2]:
import mtopic

mdata = mtopic.read.h5mu("HumanPBMC_filtered.h5mu")

mdata
[2]:
MuData object with n_obs × n_vars = 7349 × 147123
  uns:      'CELLTYPE_COLOR', 'TOPIC_CELLTYPE', 'TOPIC_COLOR'
  3 modalities
    atac:   7349 x 136915
    rna:    7349 x 10000
    prot:   7349 x 208
As in Tutorials 2 and 3, to prepare the dataset for topic modeling, we need to transform and scale the raw counts across all modalities:
- TF-IDF transformation (
mtopic.pp.tfidf) foratacandrna:Emphasizes informative, modality-specific features by balancing frequency and importance. - CLR normalization (
mtopic.pp.clr) forprot:Corrects compositional bias in protein counts across cells.
After normalization, apply mtopic.pp.scale_counts to scale total counts across modalities, ensuring balanced contribution to the topic model.
[3]:
mtopic.pp.tfidf(mdata, mod="atac")
mtopic.pp.tfidf(mdata, mod="rna")
mtopic.pp.clr(mdata, mod="prot")
mtopic.pp.scale_counts(mdata)
To train a non-spatial topic model using mtopic.tl.MTM, define the model, run variational inference (VI) for 500 iterations, and export the trained parameters to the mdata object. While we use 500 iterations in this tutorial for thorough training, the model often converges to meaningful topics in as few as 20 iterations. You can adjust the number of iterations based on dataset size and desired precision.
Trained parameters, topic distributions (variational parameters gamma) and modality-specific feature signatures (variational parameters lambda) are exported to mdata.obsm["topics"] and mdata.mod[modality_name].varm["signatures"], respectively.
[4]:
model = mtopic.tl.MTM(mdata, n_topics=30, n_jobs=100)
model.VI(n_iter=500)
mtopic.tl.export_params(model, mdata)

mdata
0%| | 0/500 [00:00<?, ?it/s]100%|██████████| 500/500 [1:25:25<00:00, 10.25s/it]
[4]:
MuData object with n_obs × n_vars = 7349 × 147123
  uns:      'CELLTYPE_COLOR', 'TOPIC_CELLTYPE', 'TOPIC_COLOR'
  obsm:     'topics'
  3 modalities
    atac:   7349 x 136915
      varm: 'signatures'
      layers:       'counts'
    rna:    7349 x 10000
      varm: 'signatures'
      layers:       'counts'
    prot:   7349 x 208
      varm: 'signatures'
      layers:       'counts'
Visualizing PBMC Results#
To visualize the MTM results, compute a 2-dimensional UMAP embedding based on the topic-cell distributions using the mtopic.tl.umap function. This projects cells into a low-dimensional space that preserves topic-driven structure.
The resulting embedding is saved in mdata.obsm['umap'] and can be used for visualization and downstream analysis.
[5]:
mtopic.tl.umap(mdata, n_components=2, min_dist=0.1, n_neighbors=20)

mdata
[5]:
MuData object with n_obs × n_vars = 7349 × 147123
uns: 'CELLTYPE_COLOR', 'TOPIC_CELLTYPE', 'TOPIC_COLOR'
obsm: 'topics', 'umap'
3 modalities
atac: 7349 x 136915
varm: 'signatures'
layers: 'counts'
rna: 7349 x 10000
varm: 'signatures'
layers: 'counts'
prot: 7349 x 208
varm: 'signatures'
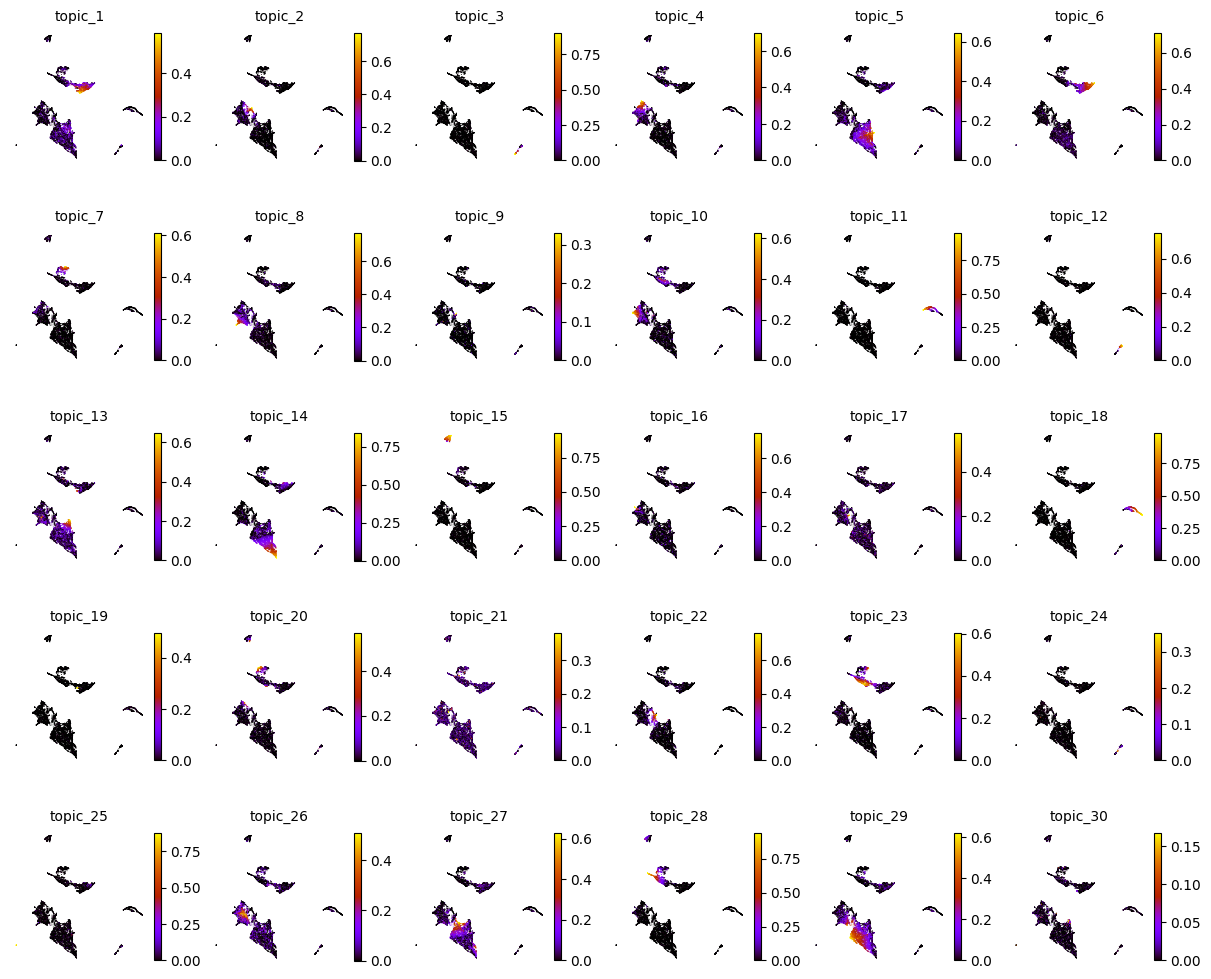
layers: 'counts'Now you can explore the topic-cell distributions by visualizing individual topic probabilities or dominant topics using functions like mtopic.pl.topics and mtopic.pl.dominant_topics.
Below, we apply the color palette (mdata.uns["TOPIC_COLOR"]) and cell type annotations (mdata.uns["TOPIC_CELLTYPE"]) prepared earlier for each topic.
[6]:
mtopic.pl.topics(mdata, x="umap", s=2)
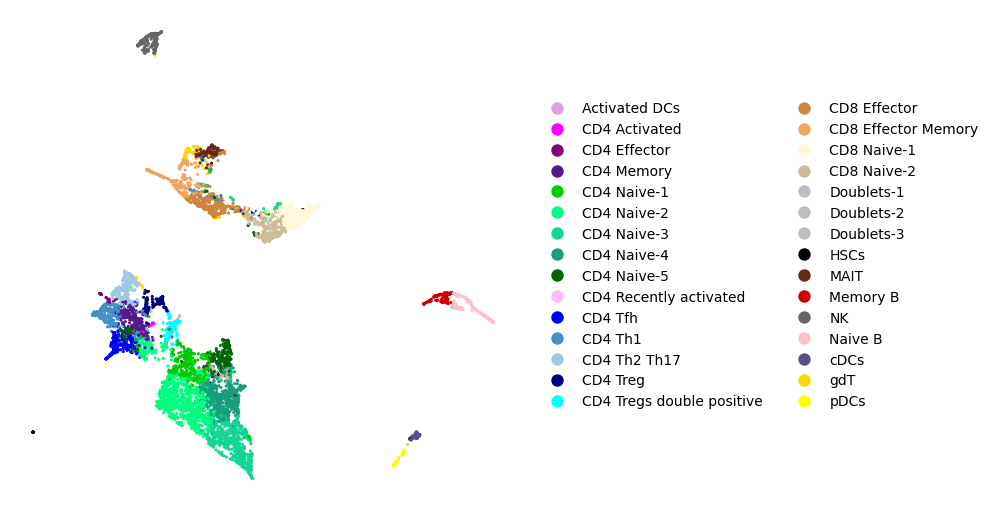
[7]:
mtopic.pl.dominant_topics(mdata,
                          x="umap",
                          s=20,
                          palette=mdata.uns["TOPIC_COLOR"],
                          annotation=mdata.uns["TOPIC_CELLTYPE"],
                          figsize=(10, 5),
                          legend_ncol=2,
                          markerscale=4)
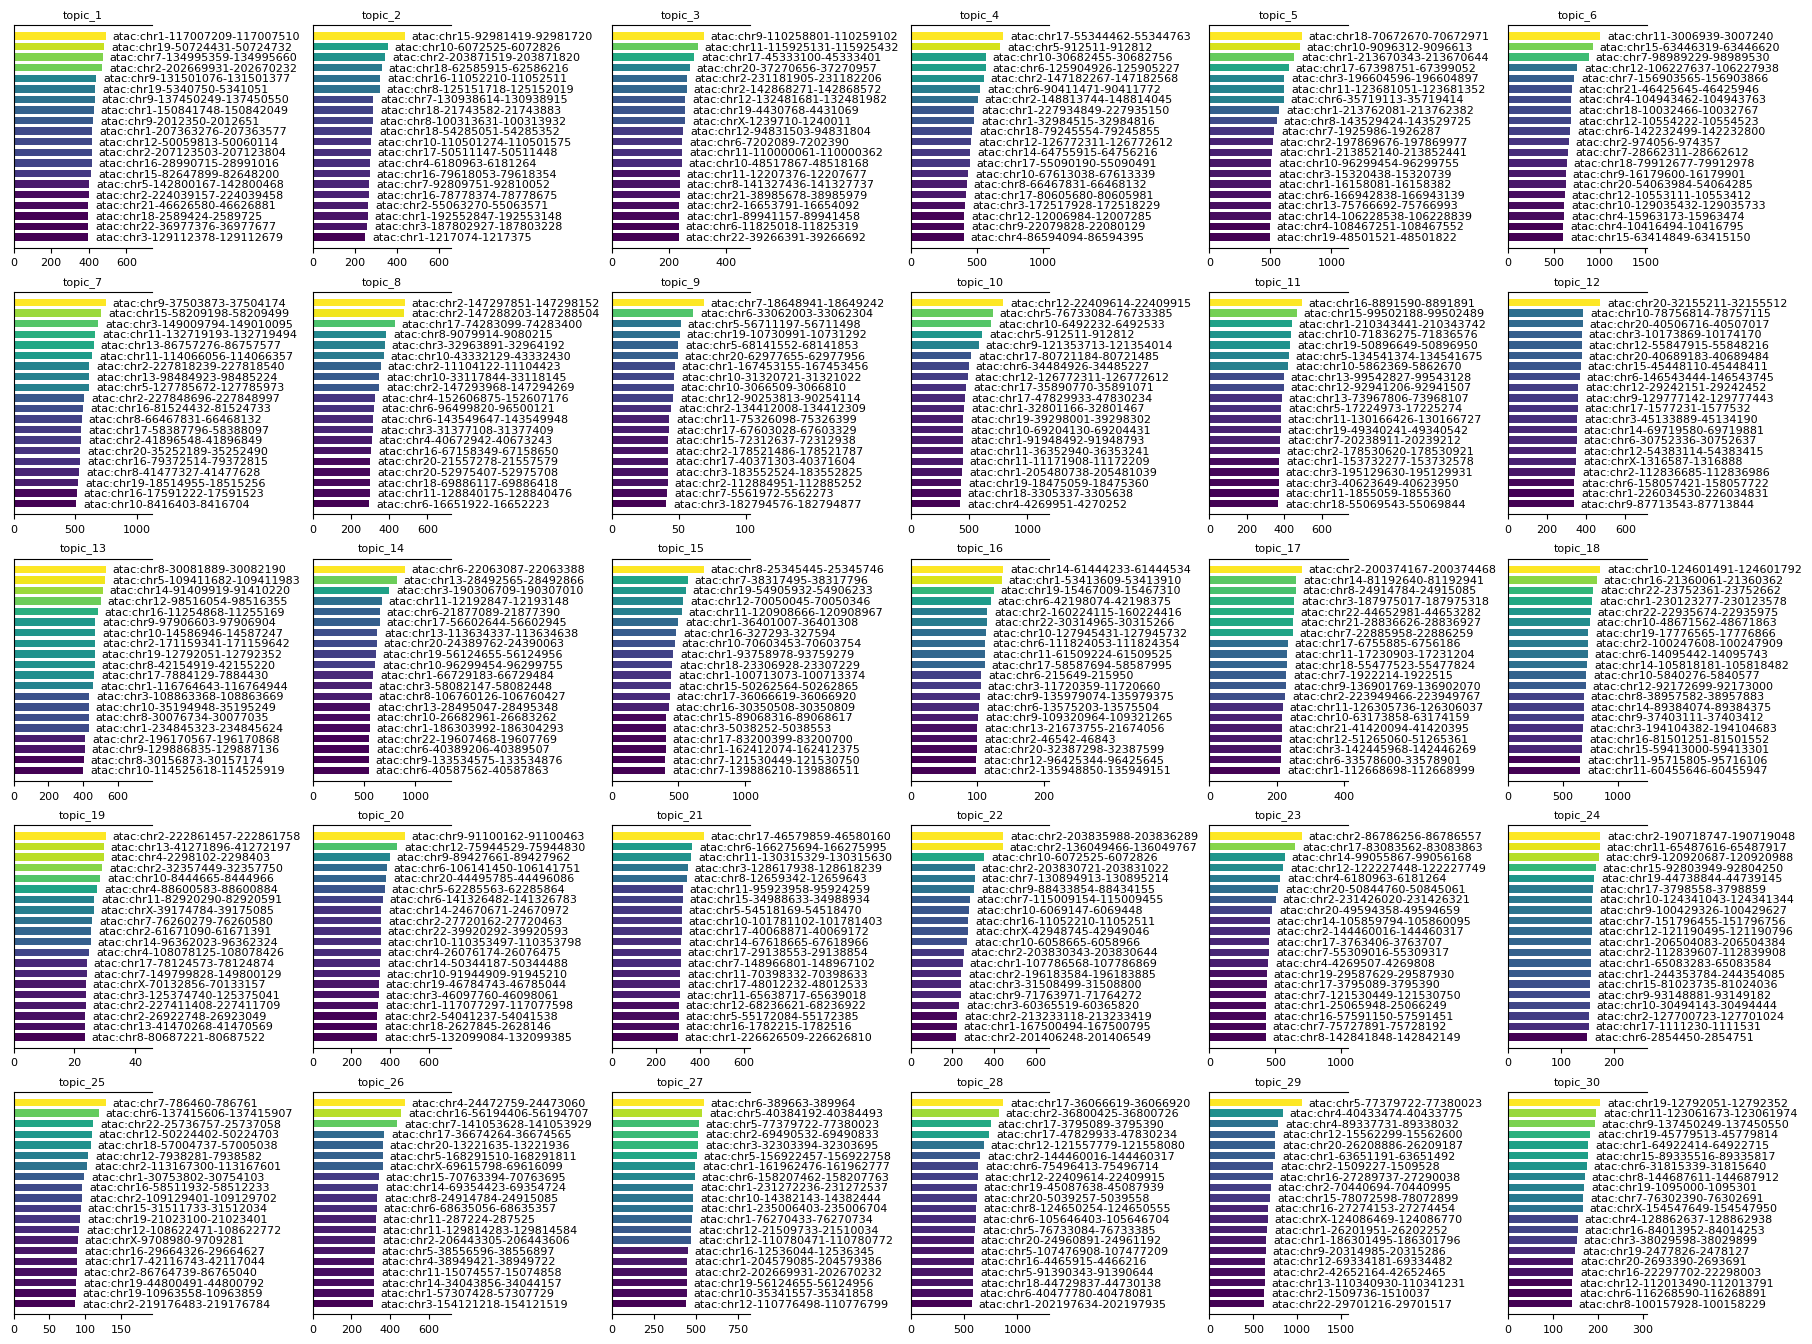
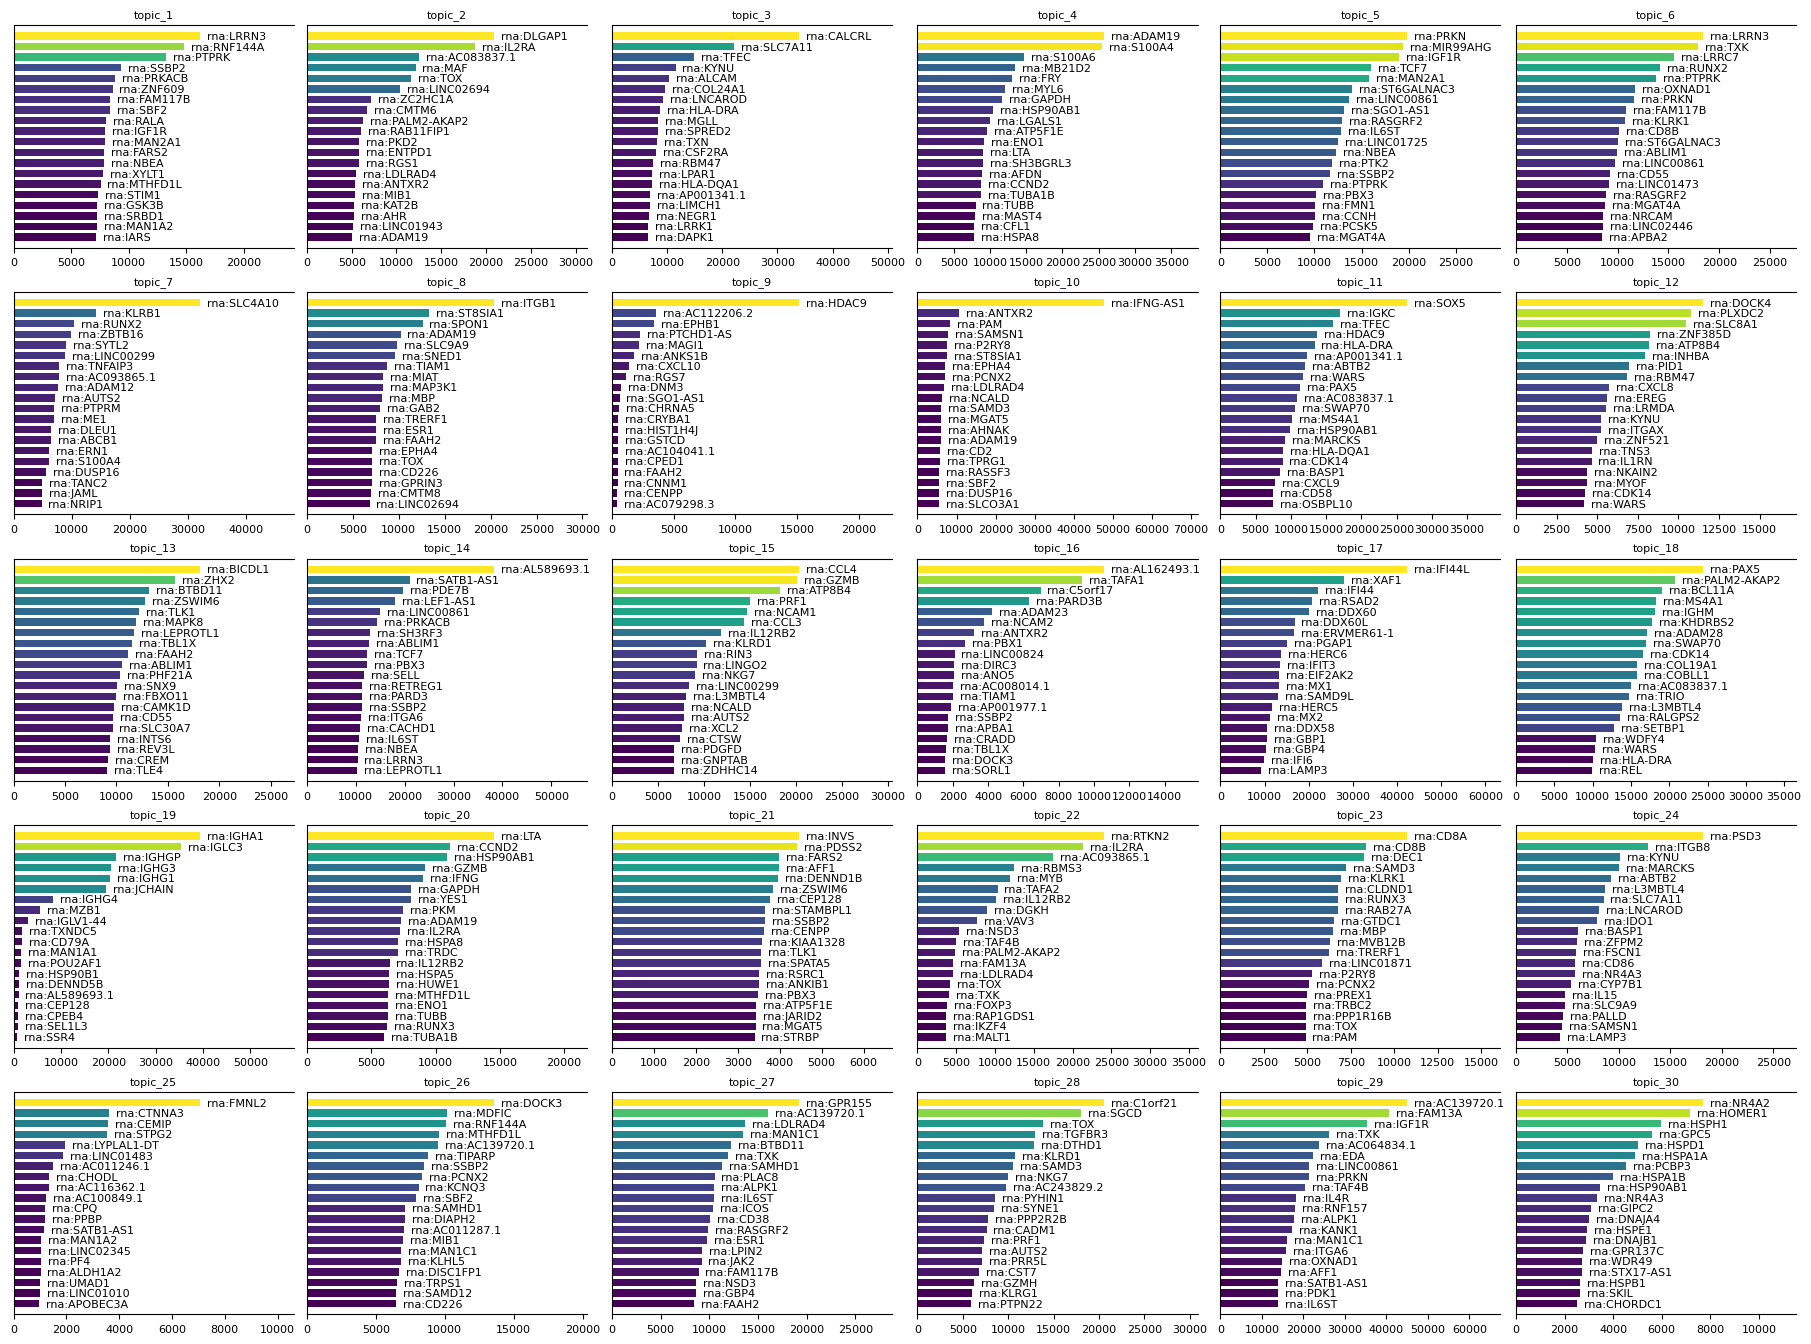
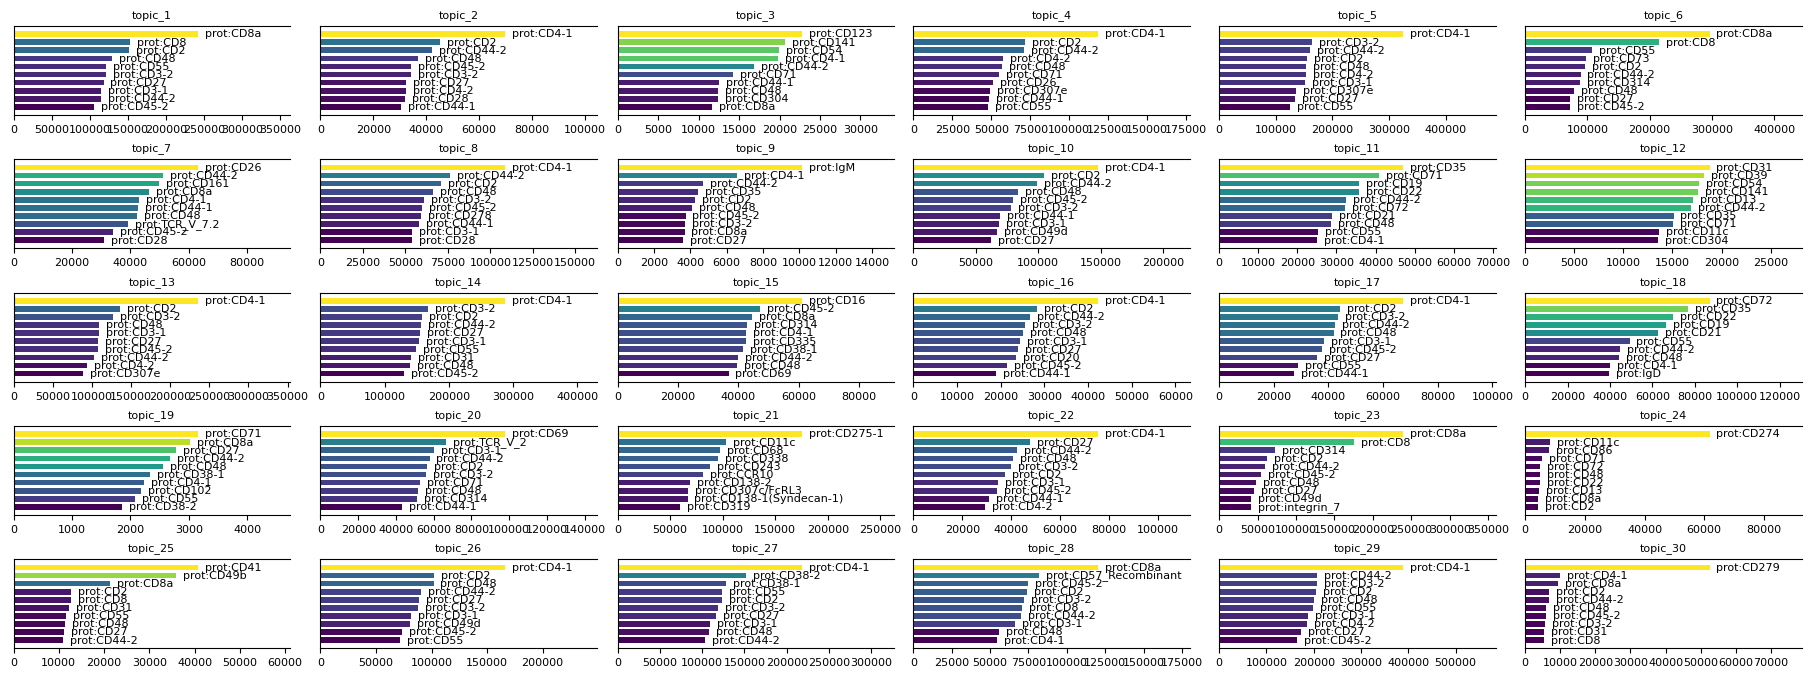
To further interpret the results of the MTM, you can plot feature signatures for each modality. Feature signatures represent the importance or contribution of modality-specific features to each topic. Use mtopic.pl.signatures to visualize the top features per topic for any selected modality, helping to identify key markers that define each topic’s biological identity.
[8]:
mtopic.pl.signatures(mdata, mod='atac', n_top=20)
[9]:
mtopic.pl.signatures(mdata, mod='rna', n_top=20)
[10]:
mtopic.pl.signatures(mdata, mod='prot', n_top=10)
This concludes the application of mTopic for modeling multimodal single-cell data, demonstrated using the trimodal human PBMC dataset.
[11]:
mdata.write("HumanPBMC_trained.h5mu")