Tutorial 5: Selecting the number of topics#
One of the key decisions when running mTopic is choosing the number of topics K, as it must be specified before the training begins. The standard approach is to train the model across several values of K and evaluate which best captures the underlying structure of your data. This tutorial introduces an automatic workflow for selecting the number of topics using held-out log-likelihood and cross-validation.
Throughout this tutorial, we use the Human Tonsil dataset. Keep in mind before you begincthat the input object must contain unprocessed counts. Preprocessing is applied internally during cross-validation, separately for each train/test split — do not normalize or transform the data beforehand.
[1]:
! wget -O HumanTonsil_filtered.h5mu \
  "https://zenodo.org/records/20044694/files/HumanTonsil_filtered.h5mu?download=1"
--2026-05-06 19:58:34--  https://zenodo.org/records/20044694/files/HumanTonsil_filtered.h5mu?download=1
Resolving zenodo.org (zenodo.org)... 188.184.103.118, 188.185.43.153, 137.138.153.219, ...
Connecting to zenodo.org (zenodo.org)|188.184.103.118|:443... connected.
HTTP request sent, awaiting response... 200 OK
Length: 18343969 (17M) [application/octet-stream]
Saving to: ‘HumanTonsil_filtered.h5mu’

HumanTonsil_filtere 100%[===================>]  17.49M  2.85MB/s    in 6.3s

2026-05-06 19:58:55 (2.76 MB/s) - ‘HumanTonsil_filtered.h5mu’ saved [18343969/18343969]
[2]:
import mtopic

mdata = mtopic.read.h5mu("HumanTonsil_filtered.h5mu")
mdata
[2]:
MuData object with n_obs × n_vars = 4194 × 5025
  uns:      'CELLTYPE_COLOR', 'TOPIC_CELLTYPE', 'TOPIC_COLOR'
  obsm:     'coords'
  2 modalities
    rna:    4194 x 5000
    prot:   4194 x 25
Running cross-validation#
You can run cross-validation to estimate the number of topics with mtopic.tl.select_n_topics. The cells are randomly split into n_folds folds. For each fold, the model is trained on the remaining folds, and the learned topic structure is used to characterise the held-out cells. The quality of this characterisation is measured as a log-likelihood — how probable the held-out data is under the model. This is repeated for every value of K in the provided range. Set is_spatial=True for
spatial datasets to evaluate sMTM instead of MTM.
Results are stored directly in mdata: per-fold scores in mdata.uns["CV_results"] and fold assignments in mdata.obs["CV_split"].
[3]:
mtopic.tl.select_n_topics(mdata, is_spatial=True, n_jobs=100)

mdata
[CV 1/5]
  K=5   LL=-91026725.43 t=99.6s
  K=20  LL=-90713726.23 t=85.9s
  K=40  LL=-90646090.54 t=130.0s
  K=60  LL=-90642637.90 t=136.5s
  K=80  LL=-90606376.09 t=147.6s
  K=100 LL=-90620322.06 t=173.6s
[CV 2/5]
  K=5   LL=-91100362.62 t=72.7s
  K=20  LL=-90729120.05 t=83.6s
  K=40  LL=-90665581.19 t=124.2s
  K=60  LL=-90653380.73 t=135.8s
  K=80  LL=-90626111.80 t=148.7s
  K=100 LL=-90636337.09 t=173.9s
[CV 3/5]
  K=5   LL=-91106016.93 t=73.1s
  K=20  LL=-90759045.79 t=80.6s
  K=40  LL=-90689924.91 t=123.0s
  K=60  LL=-90689185.89 t=134.8s
  K=80  LL=-90650532.50 t=148.5s
  K=100 LL=-90671487.12 t=172.3s
[CV 4/5]
  K=5   LL=-91043043.41 t=74.7s
  K=20  LL=-90714113.77 t=82.3s
  K=40  LL=-90652713.76 t=123.6s
  K=60  LL=-90643129.20 t=136.0s
  K=80  LL=-90607425.34 t=148.1s
  K=100 LL=-90618624.46 t=173.7s
[CV 5/5]
  K=5   LL=-90886780.00 t=74.5s
  K=20  LL=-90504830.00 t=82.2s
  K=40  LL=-90429070.49 t=124.3s
  K=60  LL=-90427087.91 t=137.3s
  K=80  LL=-90390399.27 t=149.2s
  K=100 LL=-90411502.93 t=173.3s
[3]:
MuData object with n_obs × n_vars = 4194 × 5025
  obs:      'CV_split'
  uns:      'CELLTYPE_COLOR', 'TOPIC_CELLTYPE', 'TOPIC_COLOR', 'CV_results'
  obsm:     'coords'
  2 modalities
    rna:    4194 x 5000
    prot:   4194 x 25
Identifying the number of topics K#
Visualize the results with mtopic.pl.select_n_topics. The held-out log-likelihood increases with K — adding more topics always improves the score to some degree. Because the curve never turns down, we cannot simply pick the maximum. Instead, we look for the point of diminishing returns: the value of K beyond which additional topics bring only marginal improvement. To find this point automatically, a rational function is fitted to the curve and the onset of the plateau is identified as
the point where the slope drops to 5% of its peak value. The suggested K is shown on the plot and stored in mdata.uns["CV_fit_info"].
[4]:
mtopic.pl.select_n_topics(mdata)
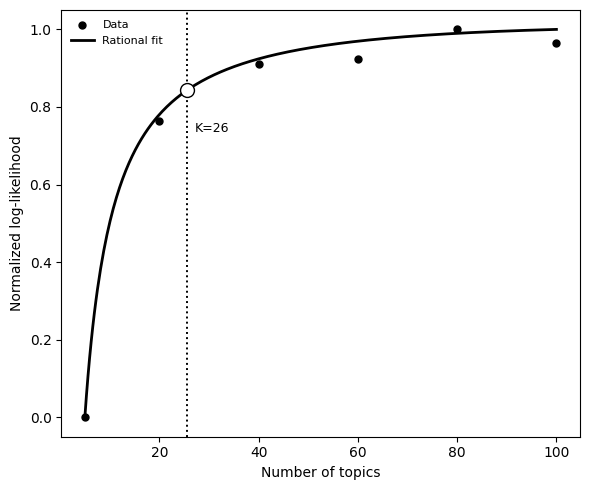
Here, the recommended number of topics, based on held-out log-likelihood, is 26.
Treat the computed K as a guideline, feel free to select more/fewer topics if you expect more/less granularity.
Conclusions#
Cross-validation gives a principled, data-driven estimate of K, but it is expensive. Running a full grid of candidate values of K with multiple folds means fitting a lot of models per dataset — which can take some time depending on dataset size. The recommended K should be treated as a suggestion rather than a hard answer. For routine use, we recommend a lighter approach: train full models at a small set of values such as K = 20, 30, 50 and pick the one at which the topics best match the granularity you need — do they correspond to known cell types, tissue compartments, or regulatory programmes?